Example comparison
RENEWABLE FRESHWATER BY COUNTRY
Freshwater comparisons are often misunderstood because renewable freshwater is mainly an annual flow generated inside a country, not a pile of water stored underground.
A country can have a large total renewable flow and still have a lower per-person figure if its population is very large.
What the data reveals
A large national flow can shrink on a per-person basis
- Brazil has the largest renewable internal flow in the table, about 1.3 times the second-ranked country.
- Among the six leading total-flow countries, Canada has the highest freshwater-per-person figure. Population changes the ordering even within the same shortlist.
- A high national total does not describe seasonal access, infrastructure, pollution or regional scarcity. The map reveals scale; it does not replace a water-security assessment.
Total flow and personal availability
| Rank | Country | Value | Year |
|---|---|---|---|
| 1 | Brazil | 5,661 billion m³/year | 2022 |
| 2 | Russia | 4,312 billion m³/year | 2022 |
| 3 | Canada | 2,850 billion m³/year | 2022 |
| 4 | United States of America | 2,818 billion m³/year | 2022 |
| 5 | People's Republic of China | 2,813 billion m³/year | 2022 |
| 6 | Colombia | 2,145 billion m³/year | 2022 |
| 7 | Indonesia | 2,019 billion m³/year | 2022 |
| 8 | Peru | 1,641 billion m³/year | 2022 |
| 9 | India | 1,446 billion m³/year | 2022 |
| 10 | Myanmar | 1,003 billion m³/year | 2022 |
| 11 | Chile | 885 billion m³/year | 2022 |
| 12 | Venezuela | 805 billion m³/year | 2022 |
| Metric | Brazil | Russia | Canada | United States of America | People's Republic of China | Colombia | Source |
|---|---|---|---|---|---|---|---|
| Freshwater per person | 26,917.87 2022 | 29,895.26 2022 | 73,170.48 2022 | 8,437.22 2022 | 1,991.89 2022 | 41,458.93 2022 | World Development Indicators |
Freshwater is a renewable flow, not a stockpile
This makes freshwater a good example for switching between additive totals and per-person metrics. Total renewable internal freshwater can be added across countries, while freshwater per person should be treated as a rate.
Use the app to compare both views. The total answers where the largest renewable flows are; the per-person metric changes the question to availability relative to population.
Start with total renewable freshwater
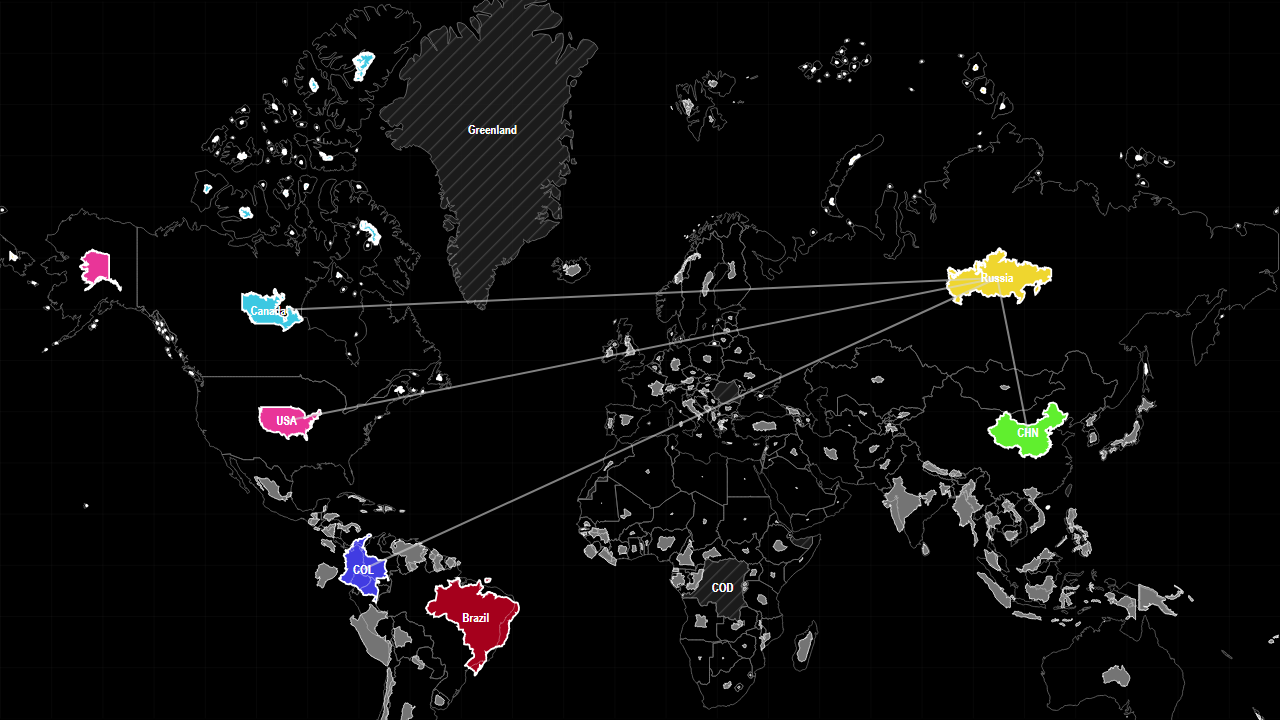
The preset starts with Brazil against Russia, Canada, the United States, China and Colombia on total renewable internal freshwater. Keep the same countries and switch to freshwater per person to expose the population effect.
Sources used on this page
- World Development Indicators: Economic, demographic, industrial, defence, water and health indicators. Source
Source reference years can differ by metric and by country. The interpretation above was reviewed against the displayed snapshot on 26 September 2026; check the linked source before citing a figure.