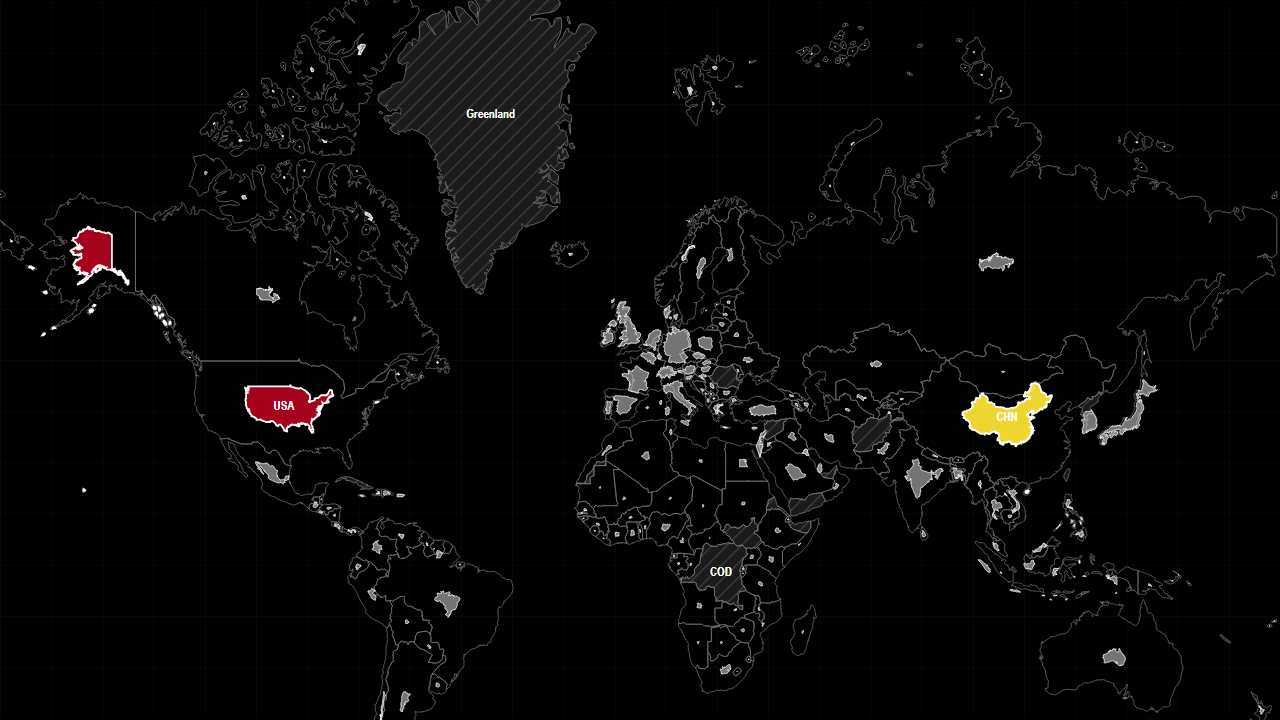
UNITED STATES VS CHINA
Compare the United States and China by GDP, population, GDP per capita and land area using sourced Compare Countries metrics.
Examples
Some country comparisons are easier to understand when the map, the numbers and the denominator are read together. Every example below explains a distinct pattern in the published snapshot, identifies an interpretation limit and links to the live map with its countries and starting metric already loaded. Open a preset, then switch metrics to test whether the first impression survives.
Compare the United States and China by GDP, population, GDP per capita and land area using sourced Compare Countries metrics.
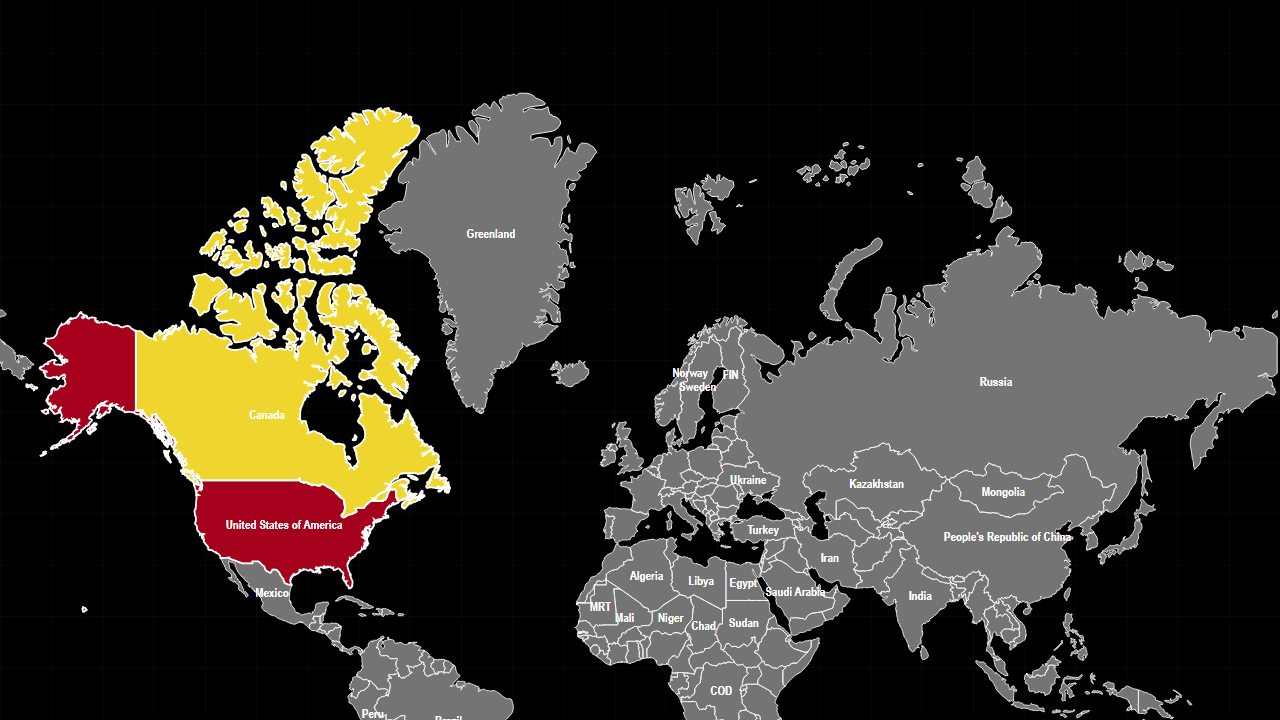
Compare the United States and Canada by land area, population, GDP, freshwater and energy metrics.
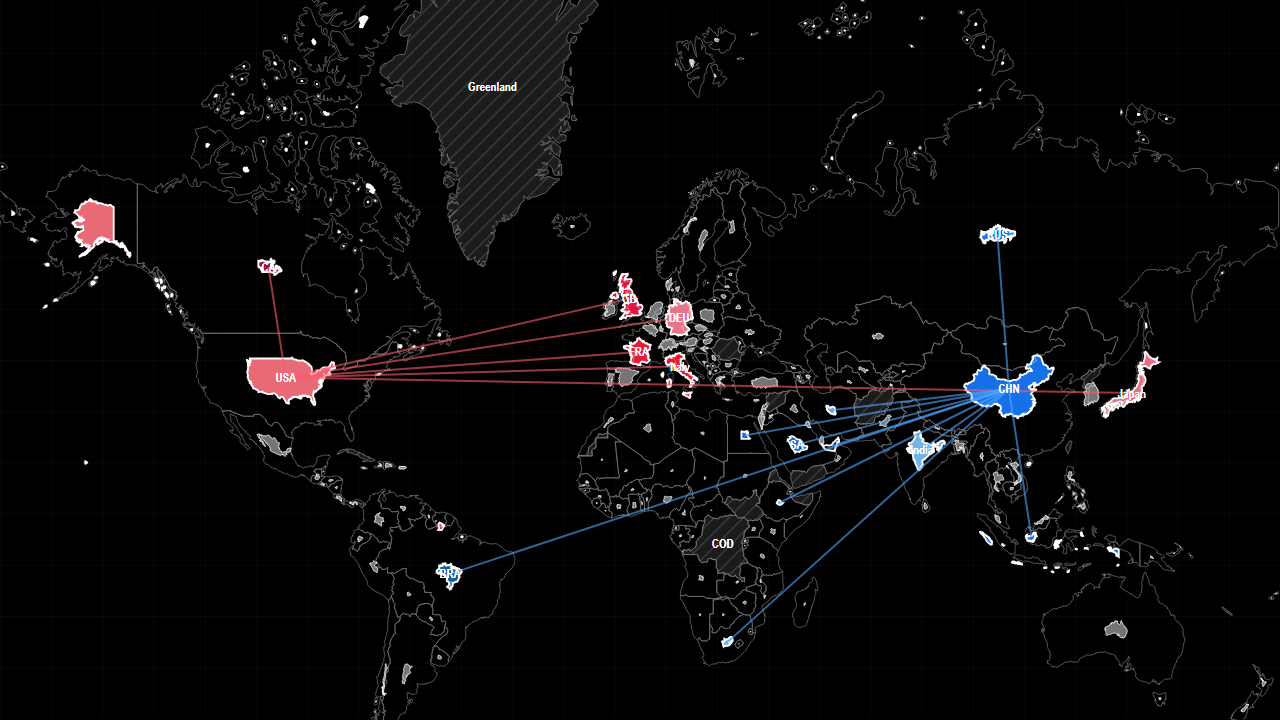
Compare G7 and BRICS country groups by GDP, population, military expenditure, electricity generation and CO2 emissions.
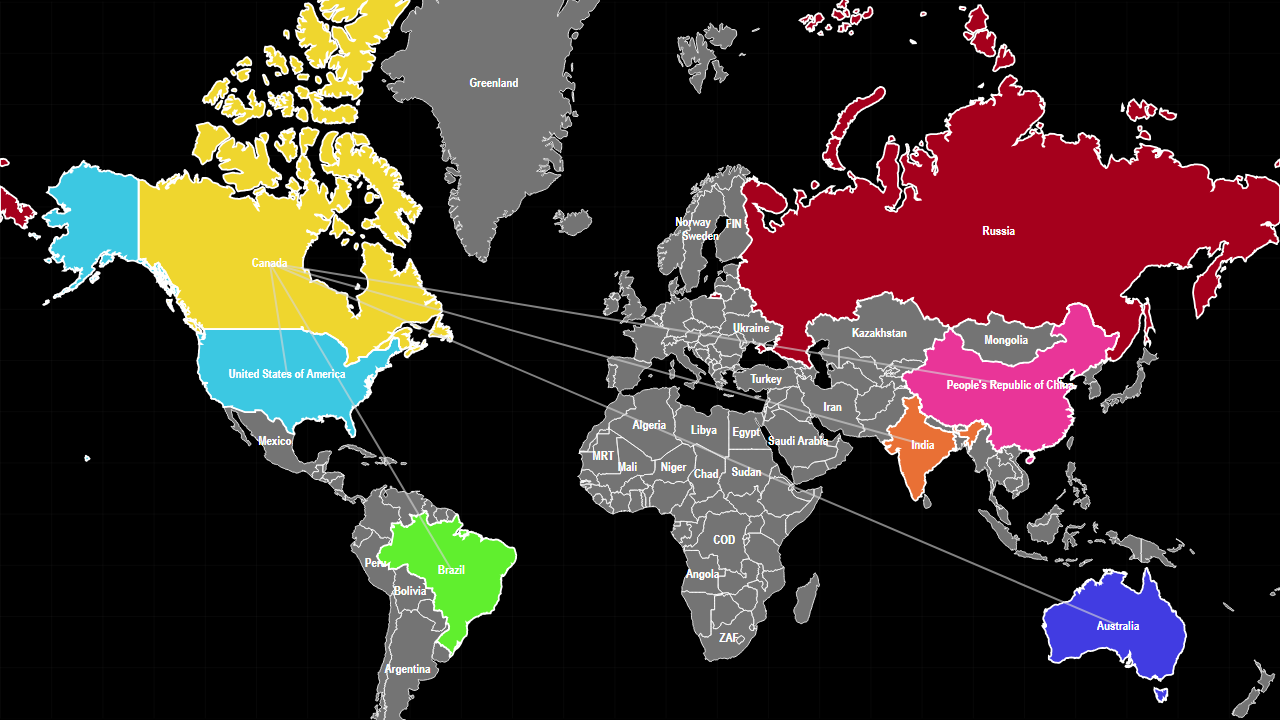
Explore the largest countries by land area and why map projection can distort visual country size.
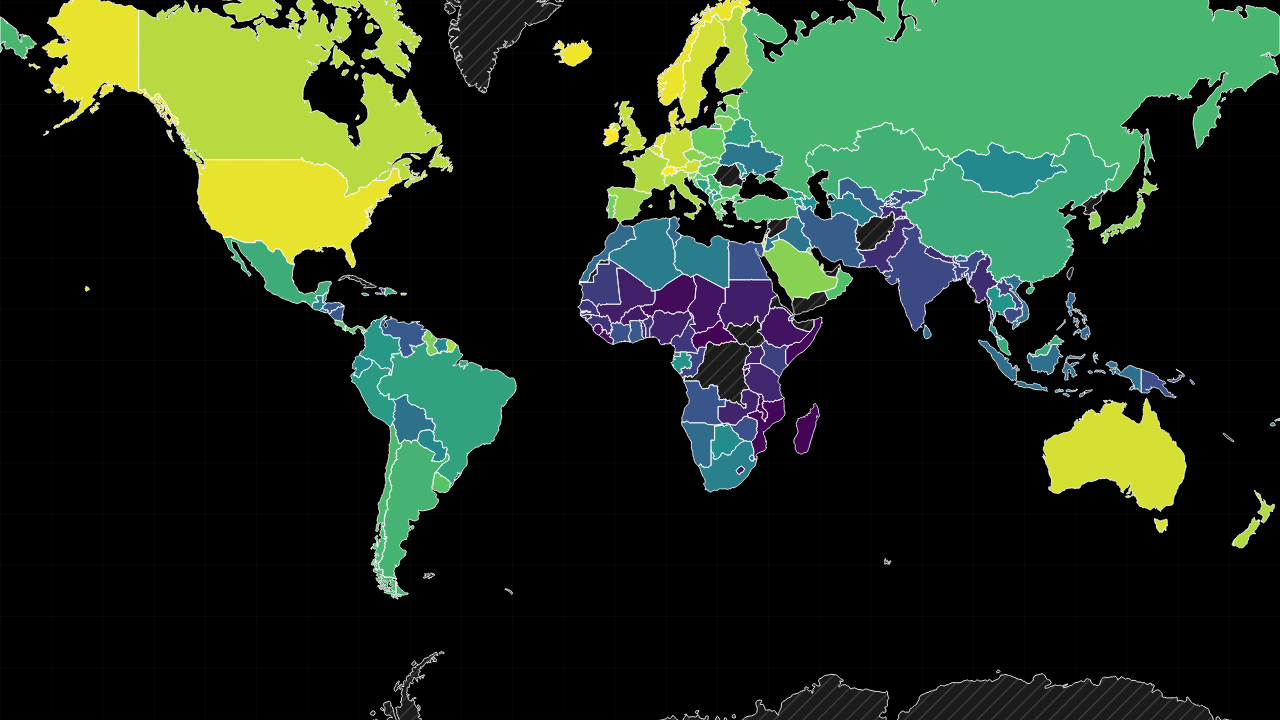
Compare countries and territories by GDP per capita using a non-additive metric and colour ranking.
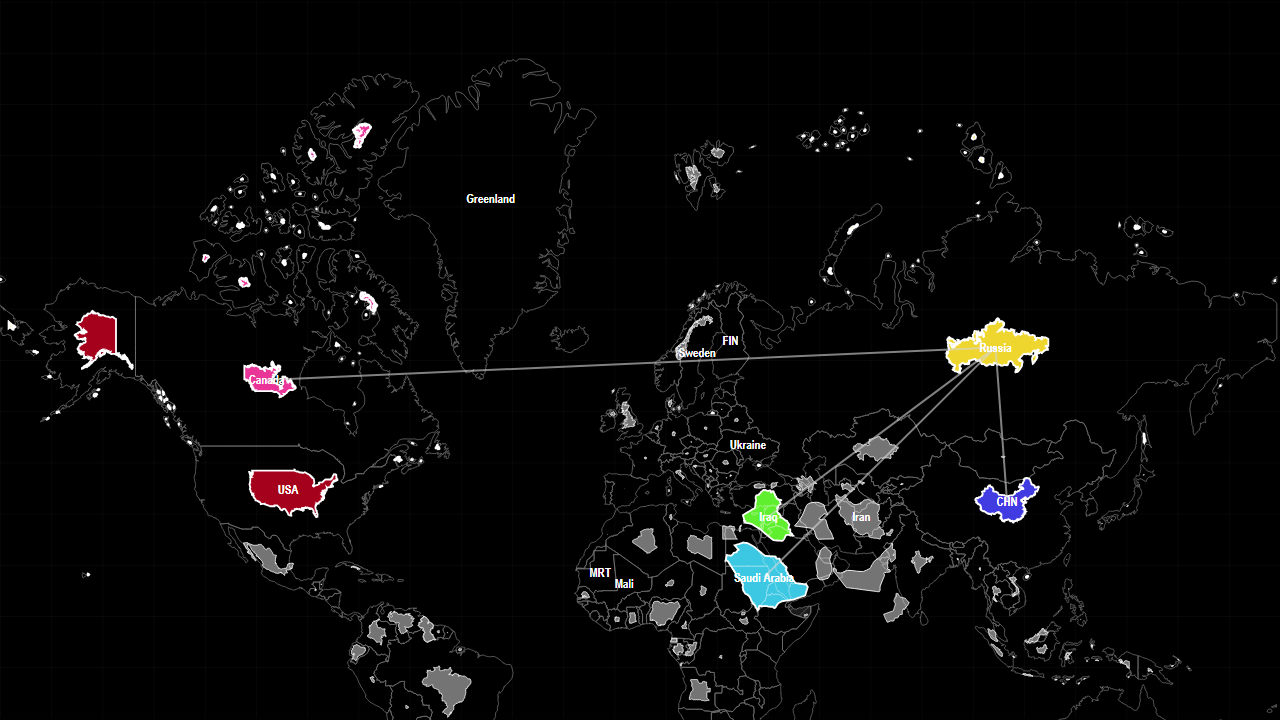
Compare crude oil production by country and explore why energy-production maps differ from population or GDP maps.
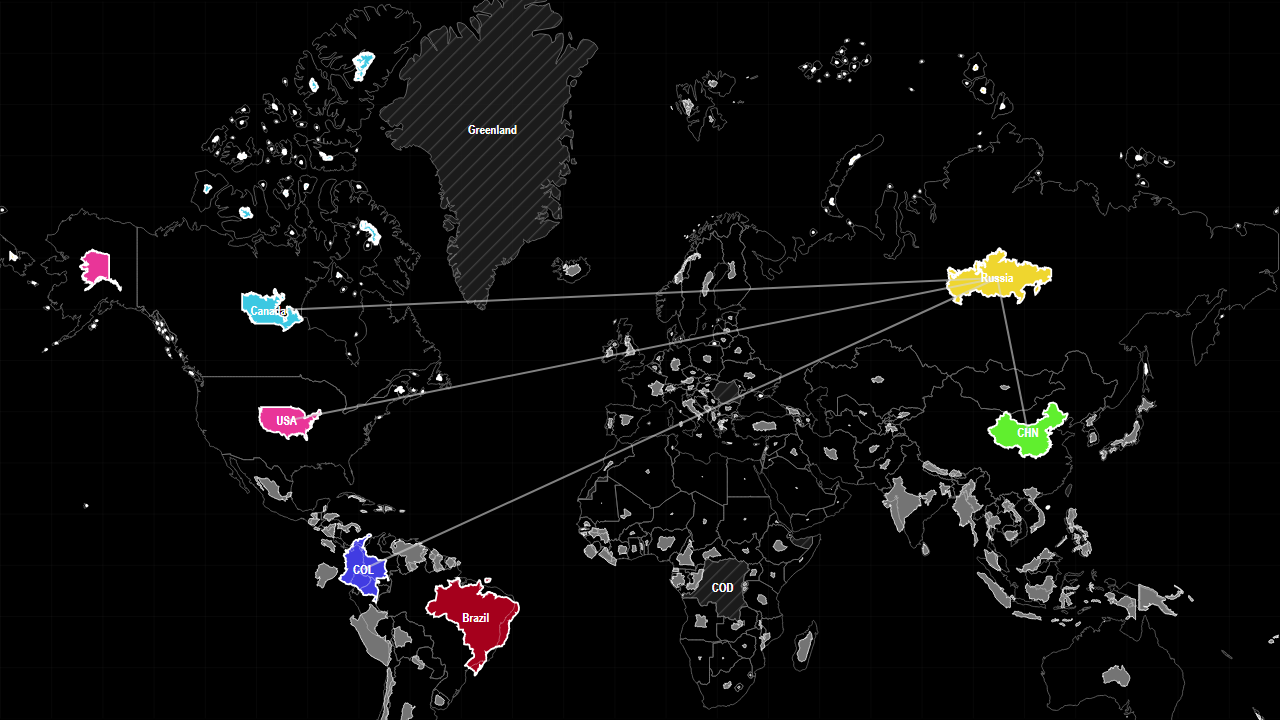
Compare renewable internal freshwater resources and freshwater per person by country.
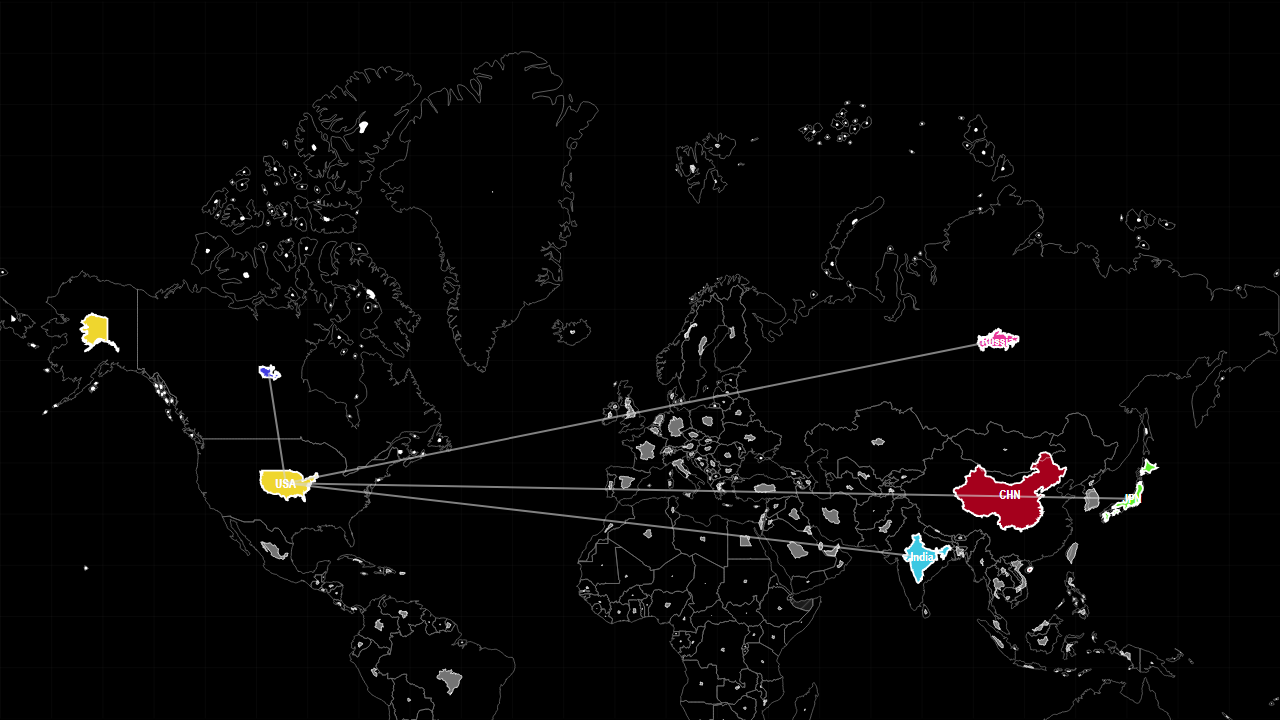
Compare electricity generation by country, including hydroelectric, nuclear, solar and wind metrics available in the app.
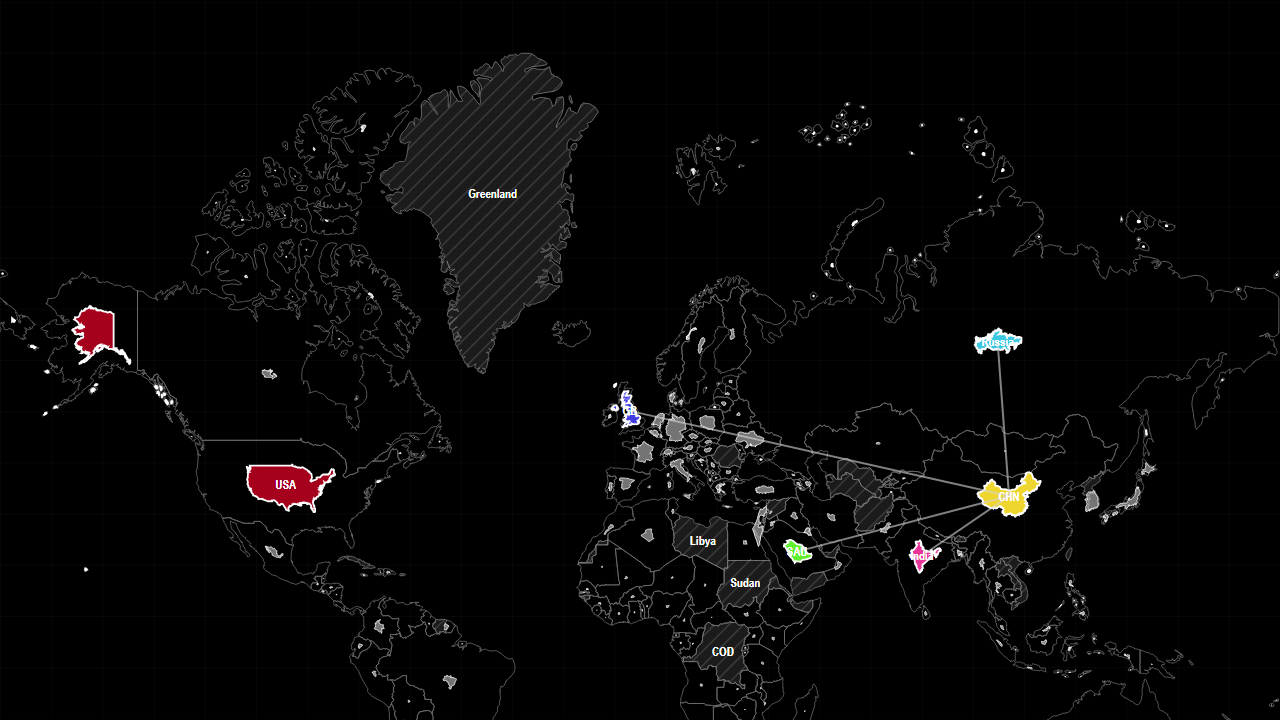
Compare military expenditure by country and see why defence spending is an additive metric in country groups.
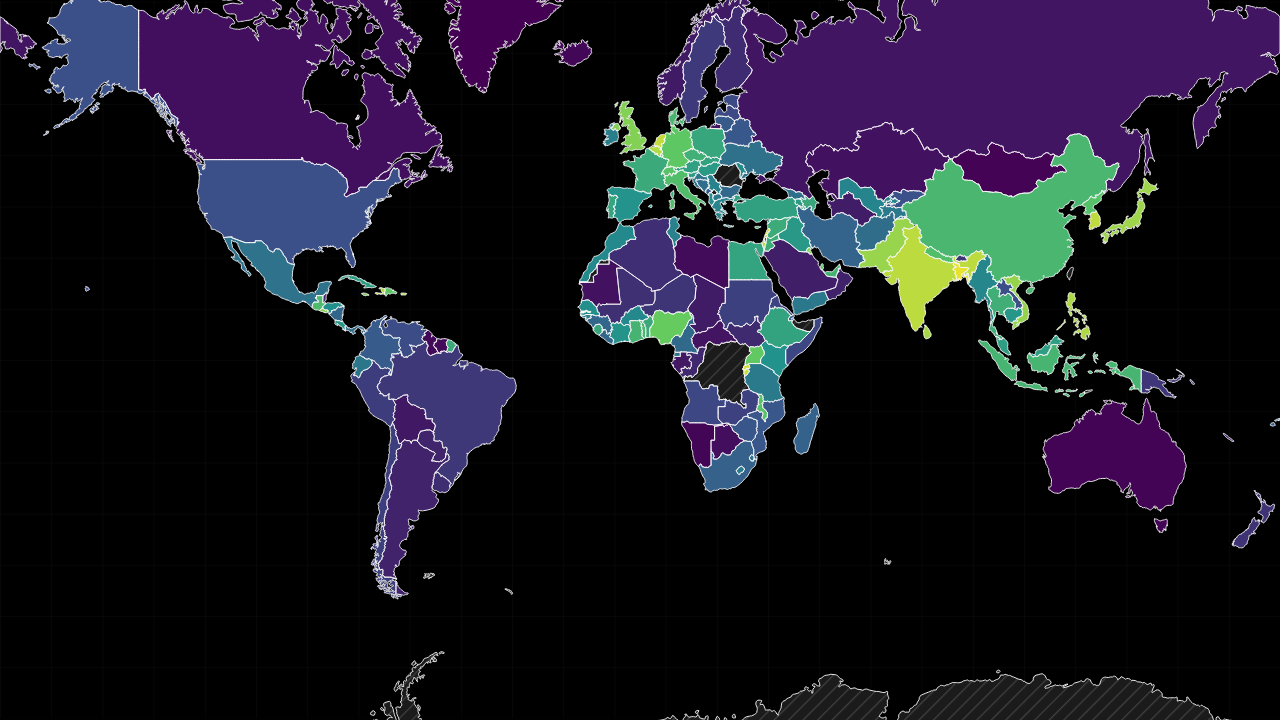
Compare countries by population density and understand why density is shown as a colour-gradient metric.