Example comparison
OIL PRODUCTION BY COUNTRY
Crude oil production is concentrated in a smaller set of countries than population or GDP.
That makes it a strong visual metric for finding countries whose energy role is much larger than their population or land area might suggest.
What the data reveals
Current output is concentrated among a few producers
- United States of America is first in the published snapshot at 13.59M barrels/day, about 1.4 times the second-ranked producer.
- The first five are United States of America, Russia, Saudi Arabia, Canada, Iraq. Their concentration creates a map that looks very different from either population or total GDP.
- This table measures current output. It does not rank proved reserves, refining capacity, exports or government revenue, all of which can place the same producers in a different order.
Production leaders in the published snapshot
| Rank | Country | Value | Year |
|---|---|---|---|
| 1 | United States of America | 13.59M barrels/day | 2025 |
| 2 | Russia | 9.89M barrels/day | 2025 |
| 3 | Saudi Arabia | 9.56M barrels/day | 2025 |
| 4 | Canada | 4.96M barrels/day | 2025 |
| 5 | Iraq | 4.39M barrels/day | 2025 |
| 6 | People's Republic of China | 4.32M barrels/day | 2025 |
| 7 | Iran | 4.05M barrels/day | 2025 |
| 8 | United Arab Emirates | 3.77M barrels/day | 2025 |
| 9 | Brazil | 3.77M barrels/day | 2025 |
| 10 | Kuwait | 2.58M barrels/day | 2025 |
| 11 | Kazakhstan | 2.05M barrels/day | 2025 |
| 12 | Norway | 1.86M barrels/day | 2025 |
Output and reserves answer different questions
A production metric is additive, so countries can be combined into groups. This allows comparisons such as OPEC against non-OPEC producers, or one producing region against another.
Production should not be confused with reserves. Production measures current output; reserves refer to economically recoverable quantities under current conditions.
Compare leading producers as a group
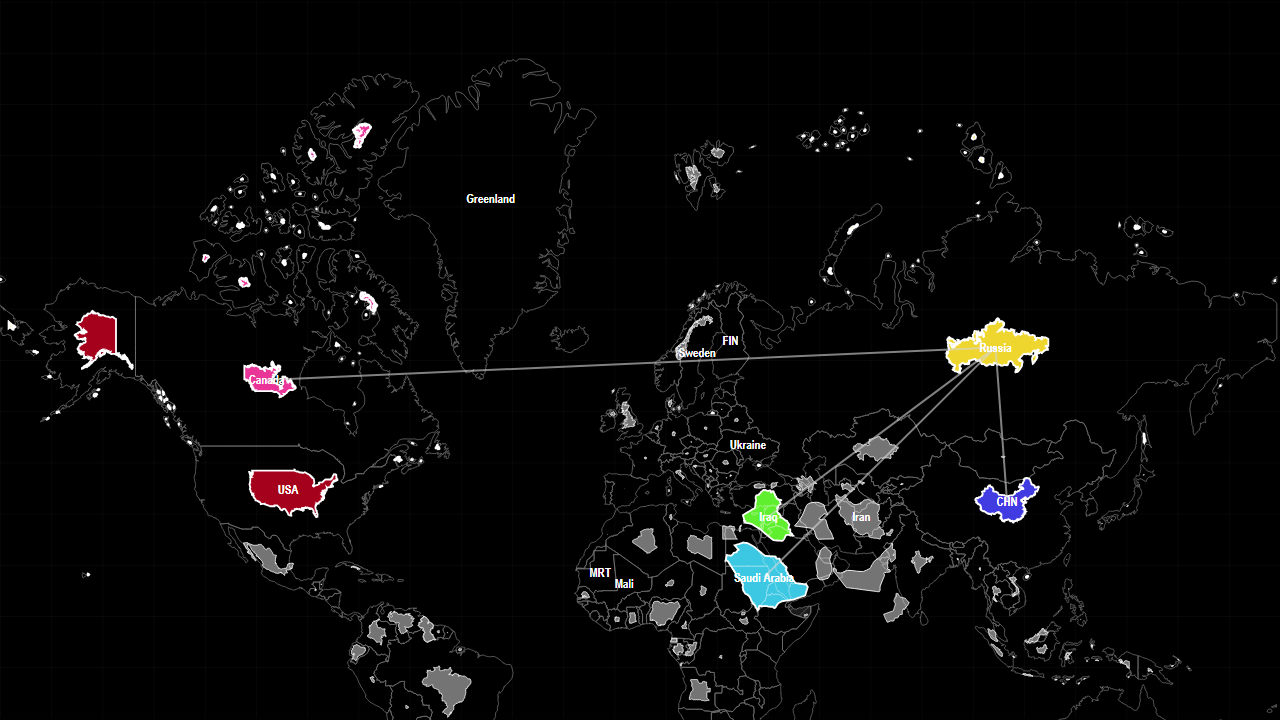
The preset places the United States against Russia, Saudi Arabia, Canada, Iraq and China. The comparison bar shows the producer values as additive segments; switch to reserves or petroleum-liquids metrics only when you intend to change the definition.
Sources used on this page
- International Energy Statistics: International oil, gas and electricity production. Source
Source reference years can differ by metric and by country. The interpretation above was reviewed against the displayed snapshot on 26 September 2026; check the linked source before citing a figure.