Example comparison
UNITED STATES VS CHINA
The United States and China are useful to compare because both sit near the top of total GDP rankings, but their economic scale rests on very different population bases.
GDP makes the two countries look like peer economic systems; population and GDP per capita immediately change that picture. The map helps separate total output from the number of people behind it.
Viewed only as a table, GDP, population and area can feel like separate facts. On the map, the contrast is easier to read: China has much more population, the United States has higher GDP per person, and land area does not explain the economic gap by itself.
This pair was chosen because it is a familiar headline comparison, but it becomes more useful when you switch metrics instead of treating one ranking as the whole story.
Key metrics
| Metric | United States of America | People's Republic of China | Source |
|---|---|---|---|
| GDP | $30.77T 2025 | $19.50T 2025 | World Development Indicators |
| GDP (PPP) | $29.18T 2024 | $38.19T 2024 | World Development Indicators |
| Population | 341.78M 2025 | 1.41B 2025 | World Development Indicators |
| GDP per capita | $90,027 2025 | $13,862 2025 | World Development Indicators |
| Land area | 9.44M km² geometry derived | 9.37M km² geometry derived | Natural Earth 1:50m Admin 0 Countries |
| Population density | 37 people/km² 2023 | 150 people/km² 2023 | World Development Indicators |
Map preview
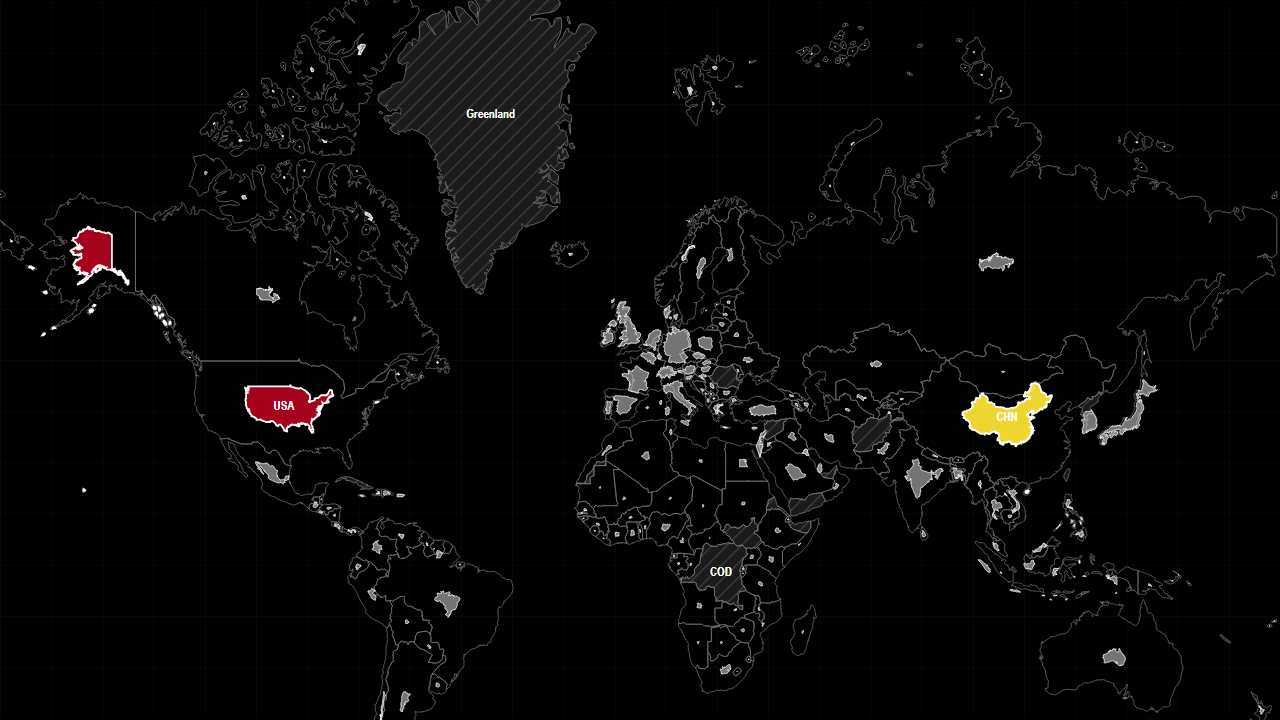
Open the live map with this metric and country selection already loaded. After the map opens, you can change the countries, switch metrics, drag countries between groups, or clear the comparison and start again.
Open this comparison on the map
Sources used on this page
- World Development Indicators: Economic, demographic, industrial, defence, water and health indicators. Source
- Natural Earth 1:50m Admin 0 Countries: Geometry only. Source
Source reference years can differ by metric and by country. Check the linked source before citing a figure.